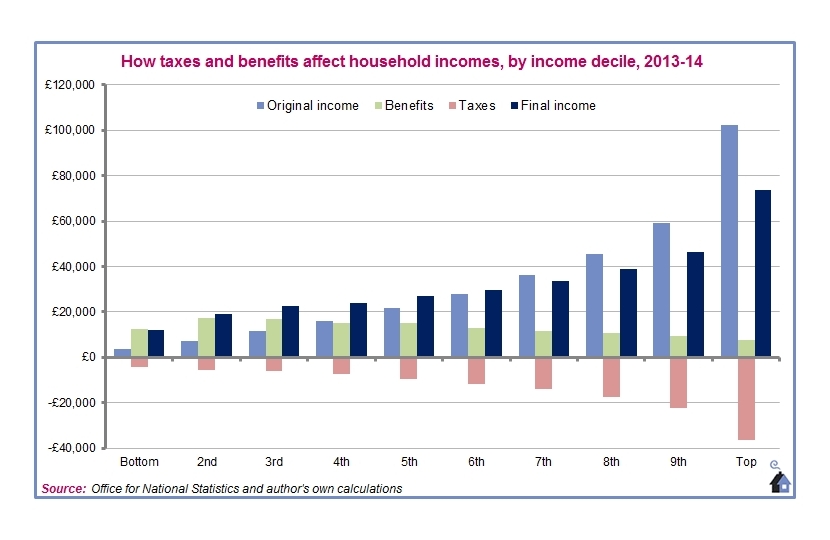
Last year the Government again helped middle-income earners to raise their standard of living. A new table of the average household incomes across ten deciles for the year 2013-14 shows how they have advanced.
In the table, the light blue bars represent their original incomes (from earnings, but also from things such as pensions and investments). The green bars are the benefits that are then added (in cash, but also in kind). The red bars are the taxes that are taken away (both direct and indirect). The final incomes are recorded by the dark blue bars.
At the bottom of the scale, the original income of £3,738 has £12,601 of benefits added to it, and £4,290 of taxes taken away, to leave a final income of £12,049. At the top, the original income of £102,366 is amended by £7,563 of benefits and £36,247 of taxes, to leave a final income of £73,682. In between, with the exception of the second decile, the taxes accumulate and the benefits decline.
In 2013-14, the crossover when net subsidees become net subsidisers came between the sixth and seventh deciles. The former had a final income that was 105 per cent of original income, the latter had one of 93.3 per cent. In 1977, this crossover point fell between the fourth and fifth deciles. In 1997, it was between the fifth and sixth.
Altogether, the economic news is good. New employment statistics show that pay packets are rising and jobs are being created. Working people have received the fastest real terms rise in over a decade, and the employment rate is the highest it has been.
This Government will continue to support firms, increase training and provide more free childcare for working parents, as well as introducing a National Living Wage. This is all part of our long-term economic plan – so we deliver a more secure future for working people in Britain.
Key Stats
- Employment: 31.09 million (up 413,000 over the past year and up more than 2 million since 2010).
- Employment rate: 73.5 per cent (up 0.7 points over the past year and up 3.3 points since 2010).
- Unemployment: 1.82 million (down 198,000 over the past year and down 686,000 since 2010).
- Unemployment rate: 5.5 per cent (down 0.6 points over the past year and down 2.4 points since 2010).
- Claimant count (Jobseeker’s Allowance and Universal Credit not in work): 791,700 in August (down 703,100 since 2010).
- Wages: average pay growth is 2.9 per cent. Inflation over the same period was close to flat.
More Stats
- Nearly half a million more people are in jobs in the private sector over the last year alone.
- Long-term unemployment has fallen by more than 240,000 since 2010, to its lowest level in six years.
- Female employment is at a record level of 14.55 million, and a record rate of 68.8 per cent.
- There are 740,000 vacancies – an increase of nearly 60,000 since last year.
- The claimant count has fallen by over 180,000 over the last year.
- Youth unemployment has fallen by 32,000 in the past year and has fallen by 215,000 since 2010.
- The UK’s employment rate has seen the largest rise of any G7 economy over the last year.
- Three-quarters of the growth in employment since 2010 have been in full-time jobs.
- Only 2.4 per cent of people in work are on zero-hours contracts.
- Real wages continue to grow – the average household is forecast to be £900 better off in 2015 than in 2010.
One way in which middle-income earners have become better off
Peter Hoskin/Conservative Home

